Edit chart
Loading graph
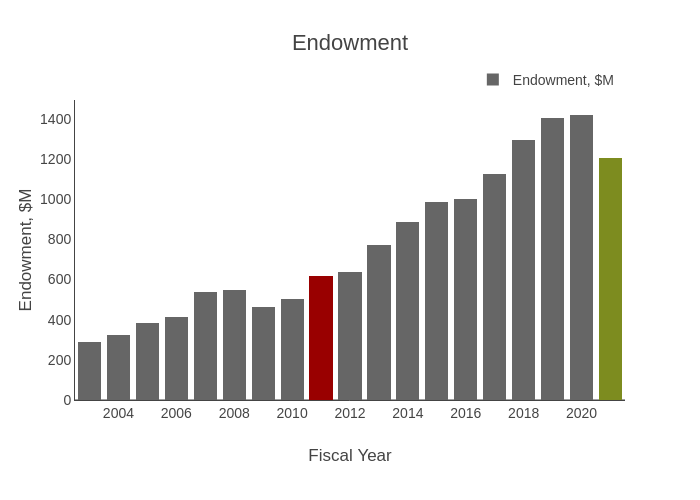
Provostncstate's interactive graph and data of "Endowment" is a stacked bar chart, showing Endowment, $M, Baseline Endowment, Goal Endowment; with Fiscal Year in the x-axis and Endowment, $M in the y-axis.. The x-axis shows values from 2002.5 to 2021.5. The y-axis shows values from 0 to 1492.6315789473683.